![]()
The college regular season is winding down. Two things loom large with the expiration of season: coaching changes and transfers.
The portal.
The next wave seems to be the elimination of the mandatory red shirt season as the ACC and Big Ten have so far supported. There’s no telling how much more activity will be inspired by the removal of the deterrent.
Believe it or not the in-season transfer action in the portal has been relatively slow. When it comes to ELITE 100 transfers the current freshman class been quiet. The surge of transfers at the holiday break didn’t come. The 2019 class hasn’t seen a top 10 player transfer. History says there will be multiple by the time the class graduates as a whole.
![]()
The 2015 class was the first to get use of the portal, which in essence allowed players to go directly to compliance to transfer out instead of going through the coaching staff. It removed a lot of fear from players and not coincidentally the number of top 100 players transferring ticked up starting with the Class of 2015.
![]()
Note that the 2016-2019 classes are still active and, if history is any indicator, the numbers will go up. Prior to the portal, the data was pretty consistent with around 25-percent of the top 100 finishing up at a different school than they originally signed with. The trend in the portal era looks like it’s going to be well over 30-percent.
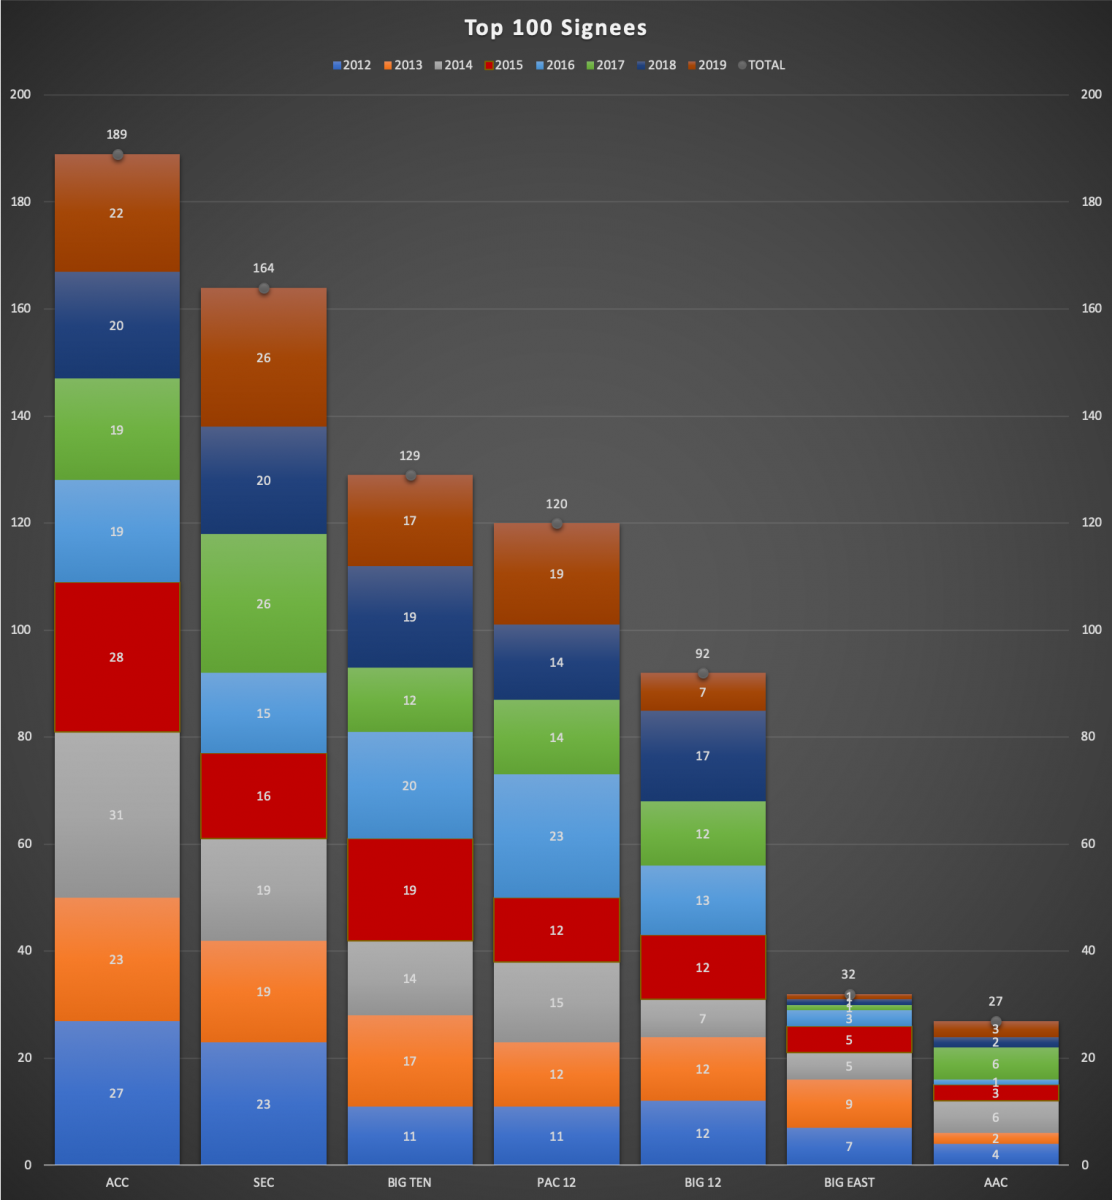
More than 85 percent of ELITE 100 sign with a program in a “Power 5” Conference – ACC, Big 12, Big Ten, Pac-12 and SEC. The next question is do they stay in the Power 5?
Portal Losers
All five Power 5 conferences have a negative net retention rate (T100 signed + T100 Xfer in – T100 Xfer out). However it appears the ACC is the biggest loser in the transfer game.
The ACC signed the most ELITE 100 players (2012-2019) while also seeing the most transfers leave. While you may point to the 15 member teams being the most of the group, that would also mean the conference has the most opportunities to land transfers. But that’s not what’s happening. The ACC is losing significantly more ELITE 100 recruits via transfer than the other leagues.
![]()
Portal Winners
The winners in the transfer portal era are the mid-major conferences with budgets it seems, except the two leagues that emerged from the breakup of the old Big East. The Atlantic-10, Conference USA, Mountain West and West Coast Conference are all growing their league’s talent through transfer, compared to the high school signees. The American Athletic Conference and the (new) Big East are basically even.
The Atlantic-10 Conference doubled the number of ELITE 100 players in league (2012-2019), signing 11 players out of high school and picking up 12 more via transfer and only losing one top 100 player to transfer (net +11). Conference USA is the next higest with a plus-six number over the same period.
BY THE NUMBERS
ELITE 100 TRANSFERS BY THE NUMBERS
From 2012-2016, average per class is 28.80 transfers from the top 100
Fewest ELITE 100 transfers: 25 (2012, 2014)
CLASS - Most ELITE 100 transfers: 37 (2015)
SCHOOL
SCHOOL - Most ELITE 100 transfers out (2012-2019):
Georgia Tech – 9
Baylor – 7
Louisville – 7
USC – 7
SCHOOL – MOST ELITE 100 transfers in(2012-2019):
Ohio State: 6
South Carolina: 6
USC: 6
Rutgers: 5
Texas A&M: 5
West Virginia: 5
SCHOOL – HIGHEST NET (Ins – Outs) (2012-2019):
Alabama: +4
Georgetown: +4
VCU: +4
SCHOOL – LOWEST NET (Ins – Outs) (2012-2019):
Georgia Tech: -8
Baylor: -6
Duke: -5
Michigan: -5
Tennessee: -5
SCHOOL – TOTAL ACTIVITY (Ins + Outs) (2012-2019):
USC: 13
Louisville: 11
Georgia Tech : 10
Kentucky: 10
Ohio State: 10
South Carolina: 10
CONFERENCE
CONFERENCE - Most ELITE 100 transfers out:
ACC: 50
SEC: 36
BIG 12: 31
BIG TEN: 28
PAC 12: 24
AAC: 6
CONFERENCE - Most ELITE 100 transfers in:
SEC: 31
BIG 12: 25
ACC: 21
BIG TEN: 21
PAC 12: 20
A-10: 12
Big East: 10
CONFERENCE – Highest Net (in – out):
A-10: +11
C-USA: +6
CONFERENCE – Lowest Net (in – out):
ACC: -29
BIG TEN: -7
BIG 12: -6
SEC: -5
PAC 12: -4
 Chris Hansen is managing editor of ProspectsNation.com and serves on the McDonald’s All-American and Naismith Trophy selection committees. He was a co-founder of and the national director of scouting for ESPN HoopGurlz from 2005 until 2012 and is the director of the Check Me Out Showcase and ELITE is EARNED events. He can be reached at chris@prospectsnation.com.