The impact of transfers on the women’s college game is growing in major way. After our first piece, analyzing the transfer rates and trends of players ranked in the top 100 coming out of high school, we look at the NCAA Transfer Portal as a whole.
The following data includes the 2018-19 partial scholastic year plus the initial transfers of the 2019-20 year through March 1. The portal did not start open until mid-October 2018 so annualized data is not available just yet for comparison.
In the 18 months since the portal began there have been 801 total Division I transfer entries. Data on where those transfers have matriculated is currently incomplete and reliant upon the new school's compliance departments to update the record of each player.
From they cycle from October 2018 to the end of March 2019 there were 139 total entries. In the same time for 2019-20 the total in-season portal entry numbers is 132, so nearly identical. If the trend continues the next six weeks will see a huge influx of transfers. From August 1, 2019 to February 29, 2020 there have been 170 transfers. That number is about to triple if last year’s rate repeats.
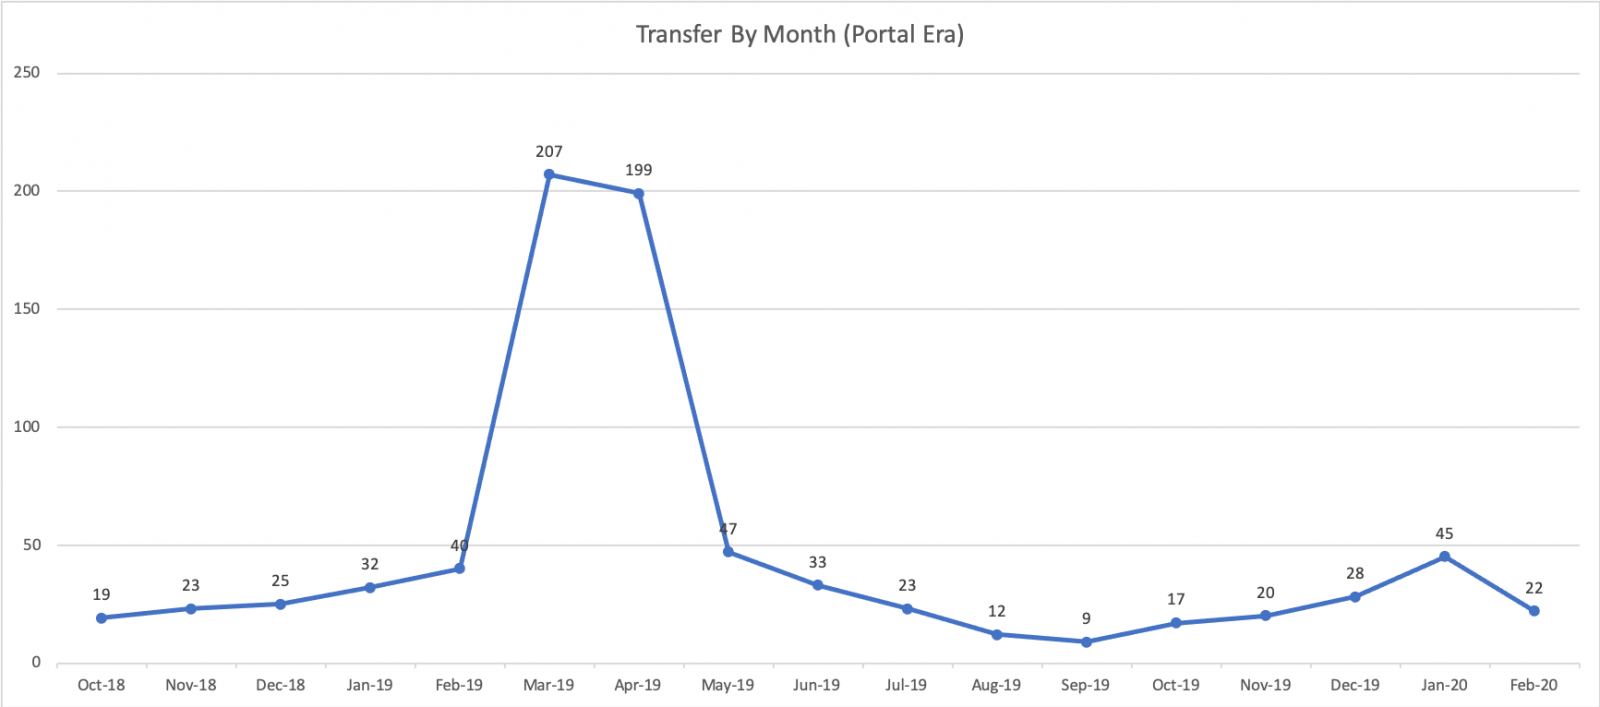
From March 1, 2019-July 31, 2019 there were 509 additional transfers. The boost makes sense since seasons start ending in March. With the current rules requiring a full red-shirt year, transferring after Spring term and starting the clock at a new school makes sense so the player can play a full season upon eligibility. This red shirt requirement is being debated and could lead to even more transfer action.
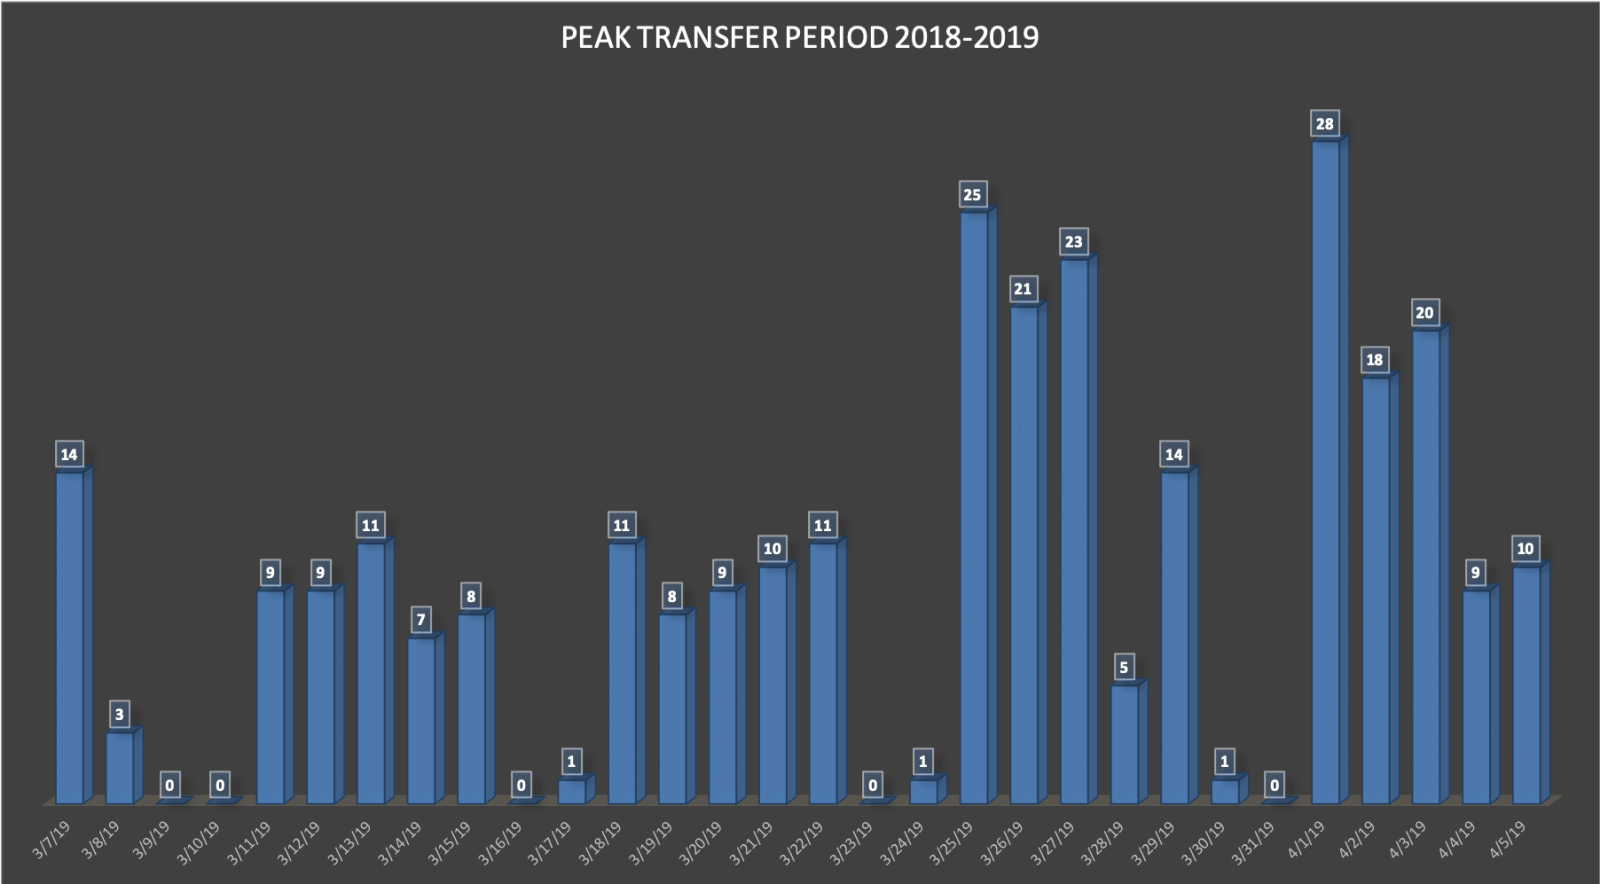
The most active 30-day period from the last 18 months was March 7, 2019 to April 5, 2019 where 286 portal entries occurred. That’s more than 70 percent of the transfers that occurred in March and April combined (406).
In the 18 months of data available, nine conferences averaged 2.70 or more transfers per team. The average for all Division I teams is 2.28.
The ACC has the most total transfers at 46 but has 15 teams. The conference with the highest average per team is the Western Athletic Conference which has nine teams that span from Seattle, Washington, to Chicago, Illinois, to Kansas City, Missouri and Edinburg, Texas and Las Cruces, New Mexico.
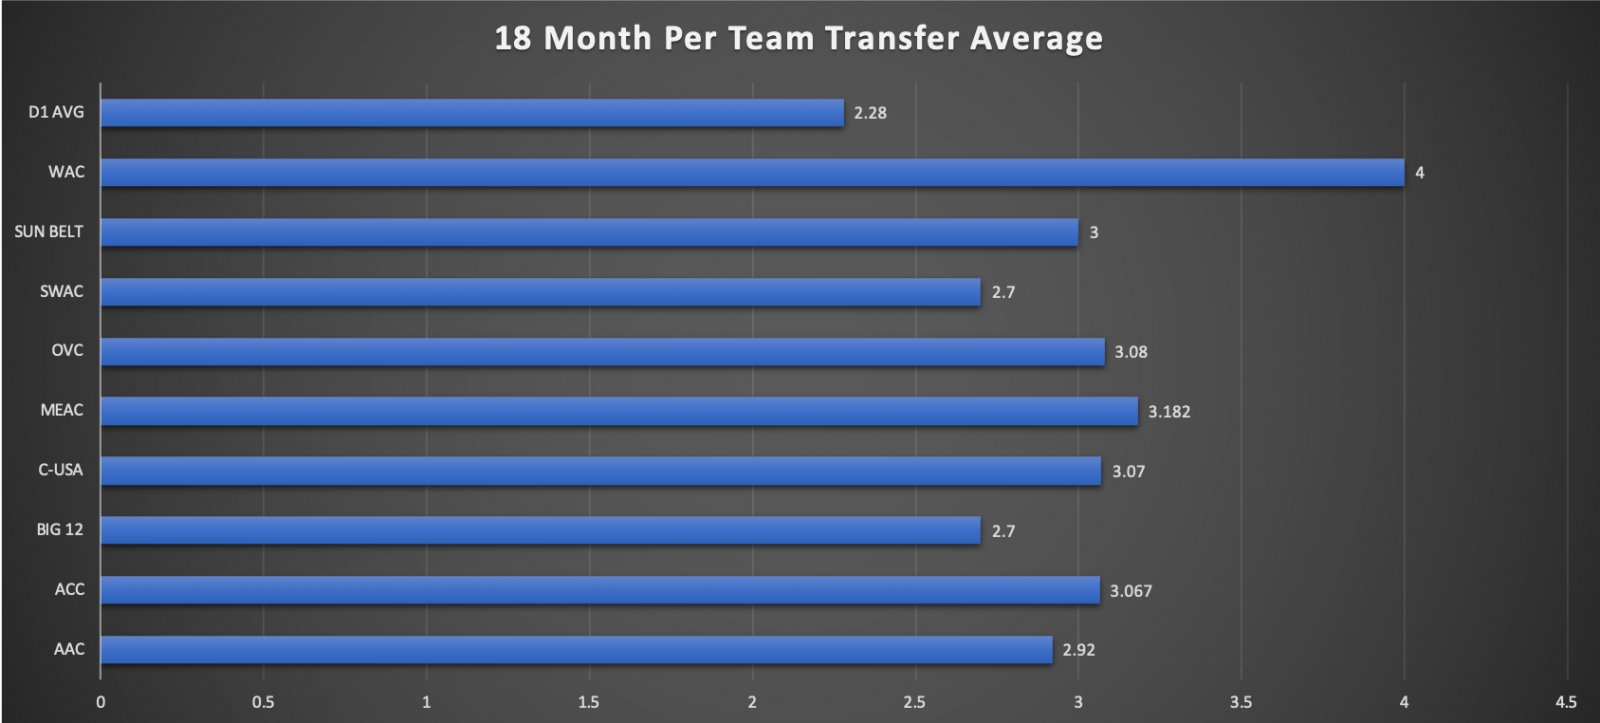
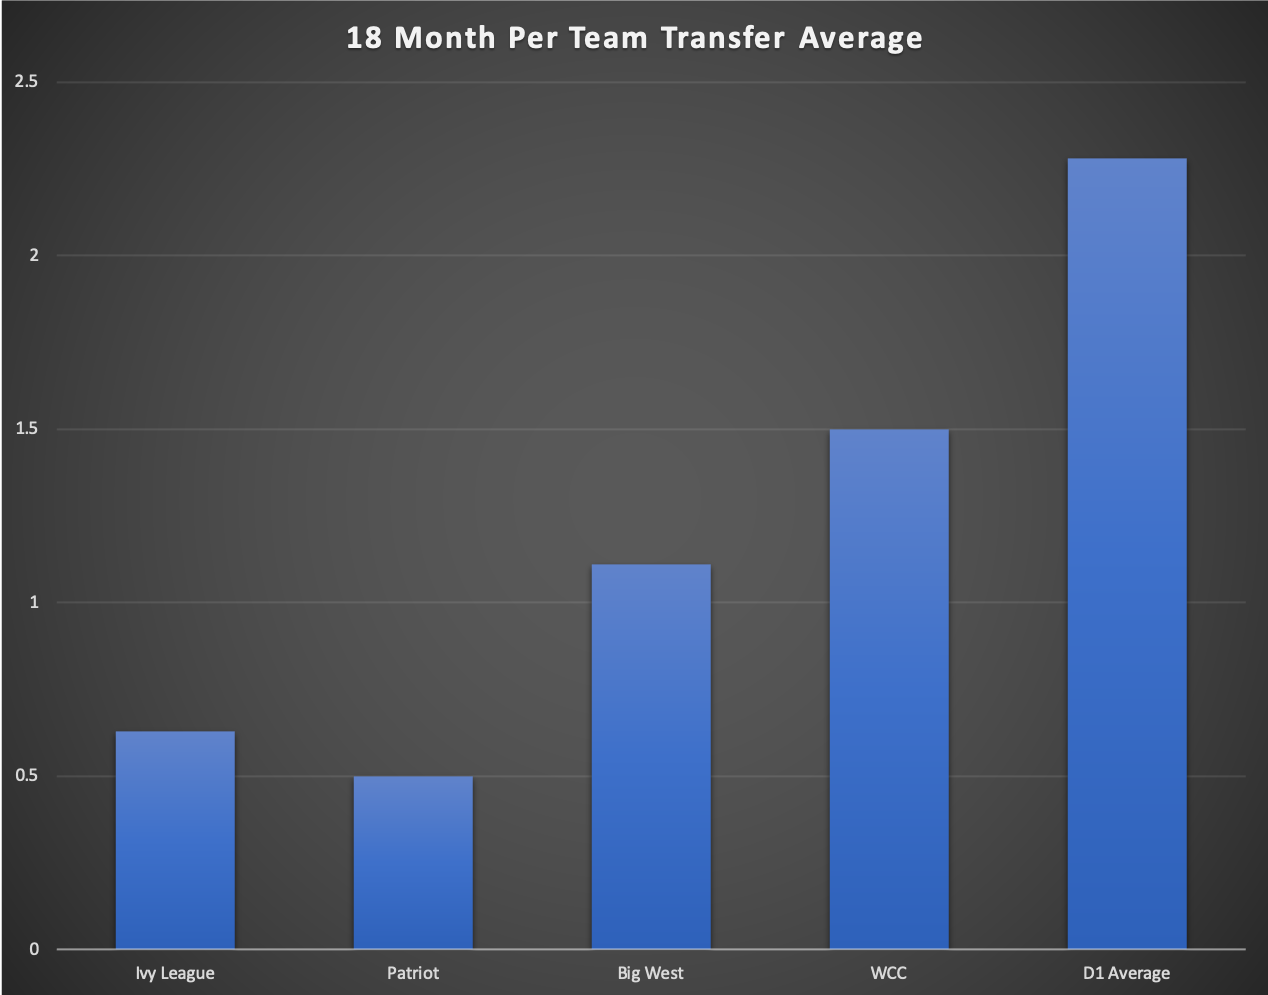
There are several conferences well below the Division I average as well. The obvious high academic leagues – The Ivy League and Patriot League – are the lowest. And despite the high rate of the WAC conference, two western region conferences round out the four lowest transfer leauges – The Big West (1.11) and the West Coast Conference.
In the 18 months of portal data that is available, 22 schools have seen six or more players enter the portal. Of those schools, half (11) had a coaching change in 2018 or 2019, which is a common immediate trigger for transfers.
The top half of that group, schools with seven or more transfers, was primarily coaching changes (8 of 11). Only Hampton University (8), Oral Roberts (7) and Syracuse (7) did not have a coaching change in the last two years.
Eastern Kentucky and Louisiana-Monroe had the highest portal entry total, with 12 each. ULM saw five of those transfers withdraw their portal applications, four were on the roster this season and one was not on any roster. For EKU, one player withdrew her application for transfer then ended up entering the following year and matriculated to another school so adjusting for that the EKU number is 11.
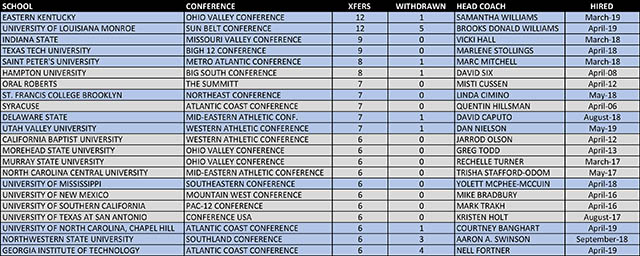
Blue highlight notates coaching change in 2018 or 2019.
The next level of analysis would be to look at where the players who enter the portal end up but that data, even dating back to 2018-19 entries is incomplete.
In the coming weeks the our research numbers on where players end up as well as conference by conference breakdowns of recruiting success with transfer included will be released.
TRANSFERS BY THE NUMBERS:
Part 1 – ELITE 100 Transfers (2012-2019)
Part 2 – The Transfer Portal Era
Part 3 – Coming Soon
 Chris Hansen is managing editor of ProspectsNation.com and serves on the McDonald’s All-American and Naismith Trophy selection committees. He was a co-founder of and the national director of scouting for ESPN HoopGurlz from 2005 until 2012 and is the director of the Check Me Out Showcase and ELITE is EARNED events. He can be reached at chris@prospectsnation.com.

